
Need to know

For #TeamEEAST Last updated: 02 May 2024 at 19:34

In order to meet our accessibility responsibilities, we at EEAST have to make sure that all of the information and data in our documents is able to be read by screen-readers.
Tables and graphs are popular ways of presenting data in an easy to understand and visually attractive way. However, they do pose challenges when it comes to accessibility. So, here are a few rules that you can follow to ensure that your documents are up to EEAST accessibility standards.
Of course, as with all things accessibility, it’s important to always bare in mind formatting, colour contrast, and text size. For more information on these things, check out other accessibility articles on the East 24 Accessibility Support Page.
When creating tables, it’s important to make sure that they are correctly formatted. Cells must line up and the pattern of the table must be consistent, otherwise screen-readers will struggle to follow a consistent path.
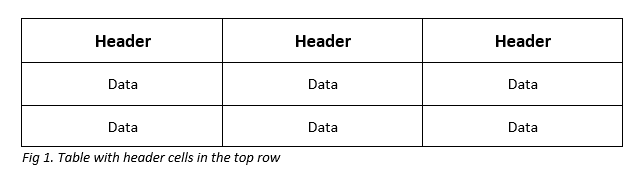
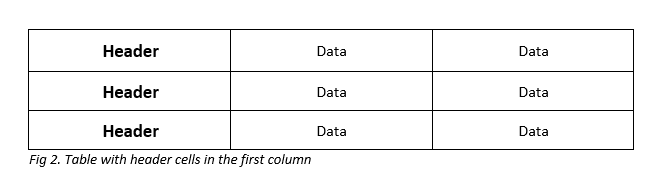
All tables must have header cells, marking what each column/row contains. Generally, the header row will be at the very top, but occasionally the header cells can also be in the leftmost column (examples below).
Also, tables will sometimes carry over across multiple pages. It’s important that the header cells are repeated on every new page. For tables with the headers at the top, there is a function in Microsoft word to automatically repeat those cells on each page.
When you click on a table in Word, two new tabs appear on your toolbar at the top of the screen – ‘Table Design’ and ‘Layout’. In the ‘Layout’ tab, on the right, there is a button called ‘repeat header rows’. This will only be possible to click if the table you have selected already breaks over multiple pages. When you click it, it will automatically repeat the top row of headers on each new page.
For tables with the title cells in the leftmost column (see fig 2.), rather than the top row, the repetition may have to be done by hand. Word does not have the function to repeat columns in the same way as rows.
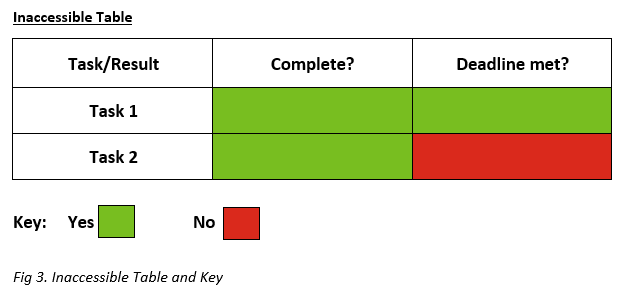
Occasionally, colours will be used in tables and charts to indicate some form of information (for example using red, orange, and green cells to show whether targets have been reached). This can pose an accessibility problem for those who cannot see all colours or colour combinations. As a result, it is important not to simply rely on a key, but rather all of the relevant information must be accessible through some means other than colour.
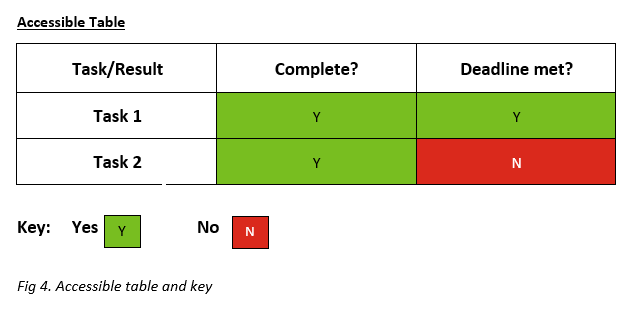
For example, the information shown by the colours could also be written in the cells or in annotations, or symbols can be used in place of or in tandem with the colours to provide a second method of representing the information.
The key is simply this – no information should ever be illustrated through colour alone.
Below you can see two examples of simple tables. The first is inaccessible – the colour of the cells is the only thing indicating the data. In the second table, with just the simple addition of some symbols in the cells, becomes accessible because there are now multiples ways of reading the data, one of which does not rely solely on colour.
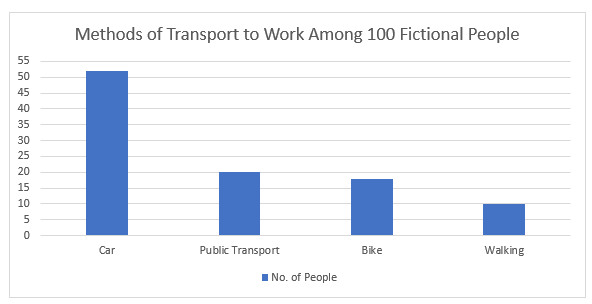
Some styles of charts cannot be read by screen-readers, no matter how we adapt or edit them. Bar charts, for example, cannot be seen by screen-readers because the only way to read the information in a bar chart is to be able to see the bars and measure their height against the scales.
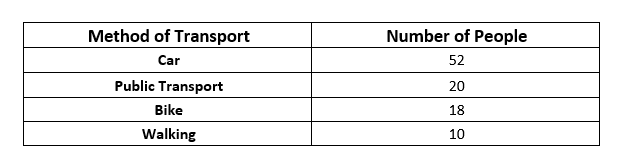
As such, when using graphs, it’s necessary to include either a table of results, or a paragraph of text showing the results, somewhere near the graph in the document. These can then be read by screen readers, and the digital team can format the graphs so that they remain visible to everyone, but are skipped over by screen readers, which will jump straight to the table or paragraph explaining the results.
Or
Of the 100 fictional people surveyed, 52 said they travel to work by car, 20 said they take some form of public transport, 18 answered that they ride their bikes to work, and 10 said they walked to work every day.
Fig 5. Bar chart with accompanying table of results and textual explanation of results
A word version of this article is attached below in the downloads section.
Published 30th September 2022